Representing Algorithms

An algorithm is a set of instructions.
It can represent any process — from a cake recipe, through to a complex computer program.
A flowchart is a visual representation of an algorithm.
Flowchart Symbols
Build your flowchart using these symbols. In an exam, always use a pencil and ruler to keep things neat and easy to change.
Terminator
Shows the start and end of the flowchart

Input / Output
Asks for, or outputs, information

Process
Something which will be done (e.g. adding)
Decision
Branches to different parts of the algorithm, depending on whether a statement is True or False.

Arrows
Links each shape to the next one. Most of the time, arrows point up or right.
Example Flowchart
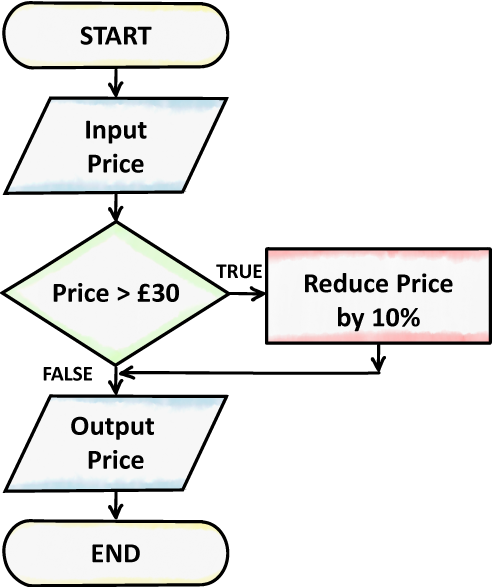
This flowchart could be used by a shop offering a 10% discount on spending of more than £30.
- Ask the user to input a price
- Check if the price is greater than £30
- If it is, reduce the price by 10%, then return to the main algorithm
- If it is not, continue with the main algorithm
- Output the price to the user. The price will either be the same as it was originally, or reduced by 10%, depending on which way the flowchart branched
Creating a Flowchart
Following these steps will help you to create a flowchart for a given problem:
- Identify our inputs. Which symbols do we need? What variables do we need to store them?
- Identify our processes. What symbols do we need? Are any decisions needed?
- What outputs do we need? What information does the user need?
- Put our symbols in order — this is usually the same order as the question
- Add the arrows. Ensure all paths lead to the end
- Test our algorithm with different inputs to ensure all possibilities work
Pros and Cons of Flowcharts
- Clear and easy to visualise
- Easy to follow — especially for non-experts
- Simple to spot errors
- Complex for large algorithms
- Difficult to change
- Take time to create