Developing the Human Computer Interface (HCI) of your spreadsheet is a key part of your coursework. It's worth a lot of marks, so it's important to get it right.
Remember to use any graphics or colour schemes provided, and create your design and layout to match them. This creates a clear, consistent, and professional look for your project.
Using Tables
A table is a structured way of organising data in a spreadsheet. Benefits of tables are:
- They keep your data organised
- Automatically expand as you add more data
- Built-in sorting and filtering options
- Look professional
- Allow Excel to automatically complete some calculations
- Make the creation of charts and graphs easier
Steps to create a table:
- Select your data (including headings)
- Click: Insert → Table or Format as Table
- Tick My table has headers
- Click OK
There are several built-in formatting options for you to choose from, helping you to make tables match the rest of your design.
Text Presentation
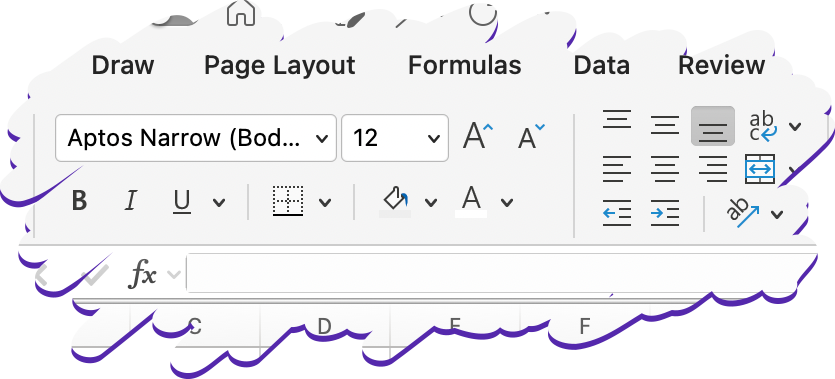
Typeface: Choose a simple, easy-to-read style rather than a fancy one. Use the same one throughout.
Font size: Choose a size which is easy to read, but does not take up too much space. Size 12 is usually fine.
Emphasis: Use bold and italic fonts to emphasise key values, such as the total of a calculation
Borders: Use to structure tables and separate information, making it clearer to read. Cells with borders can also be used to show an area for the user to type.
Colour: Colour cells or text to highlight information. Remember to keep to the colour scheme. Usually, no more than two colours should be used throughout your project.
Alignment: Use the following guide to align your text professionally:
- Left: text
- Centre: headings and titles
- Right: numbers
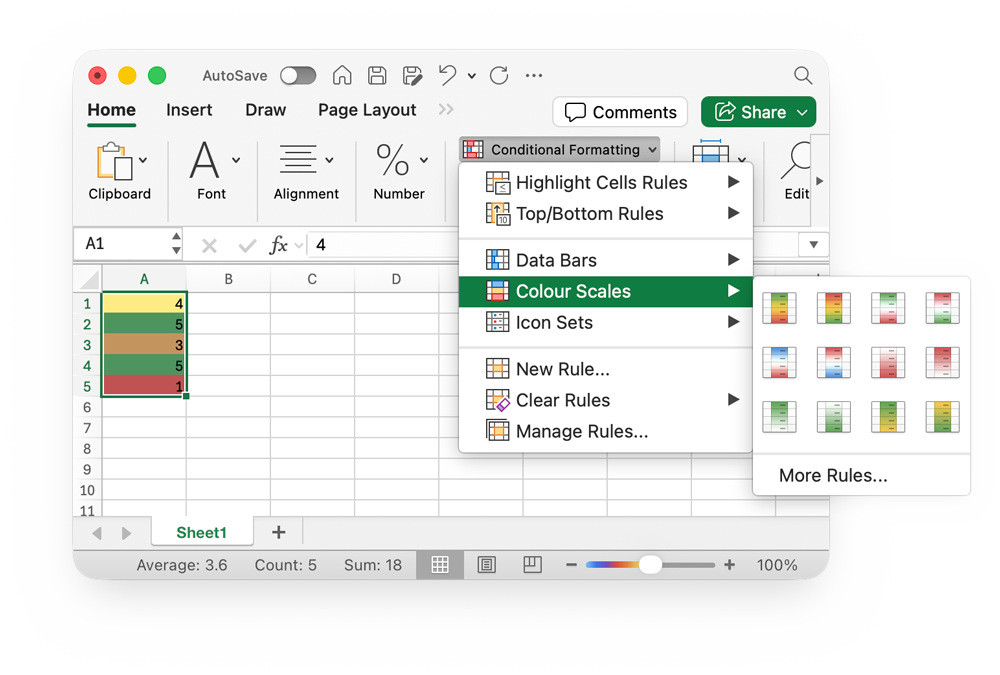
Conditional Formatting
Excel can automatically add colour to a cell, depending on the value in it. Example: a score over 50% would be in green, but below 50% would be red.
This is useful for spotting patterns quickly.
- Select the range of data
- Click Conditional Formatting
- Click Colour Scales
- Choose the style you want
- Excel will automatically apply the colours to your cells
There are also customisable rules you can define, click New Rule to get started with them.